
Diminishing seasonality of subtropical water availability in a warmer world dominated by soil moisture–atmosphere feedbacks
ZHOU Sha | Nature Communications
Diminishing seasonality of subtropical water availability in a warmer world dominated by soil moisture–atmosphere feedbacks
Sha Zhou, A. Park Williams, Benjamin R. Lintner, Kirsten L. Findell, Trevor F. Keenan, Yao Zhang & Pierre Gentine
Nature Communications
Published September 30 2022
https://doi.org/10.1038/s41467-022-33473-9
Abstract
Global warming is expected to cause wet seasons to get wetter and dry seasons to get drier, which would have broad social and ecological implications. However, the extent to which this seasonal paradigm holds over land remains unclear. Here we examine seasonal changes in surface water availability (precipitation minus evaporation, P-E) from CMIP5 and CMIP6 projections. While the P-E seasonal cycle does broadly intensify over much of the land surface, similar to 20% of land area experiences a diminished seasonal cycle, mostly over subtropical regions and the Amazon. Using land-atmosphere coupling experiments, we demonstrate that 63% of the seasonality reduction is driven by seasonally varying soil moisture (SM) feedbacks on P-E. Declining SM reduces evapotranspiration and modulates circulation to enhance moisture convergence and increase P-E in the dry season but not in the wet season. Our results underscore the importance of SM-atmosphere feedbacks for seasonal water availability changes in a warmer climate.
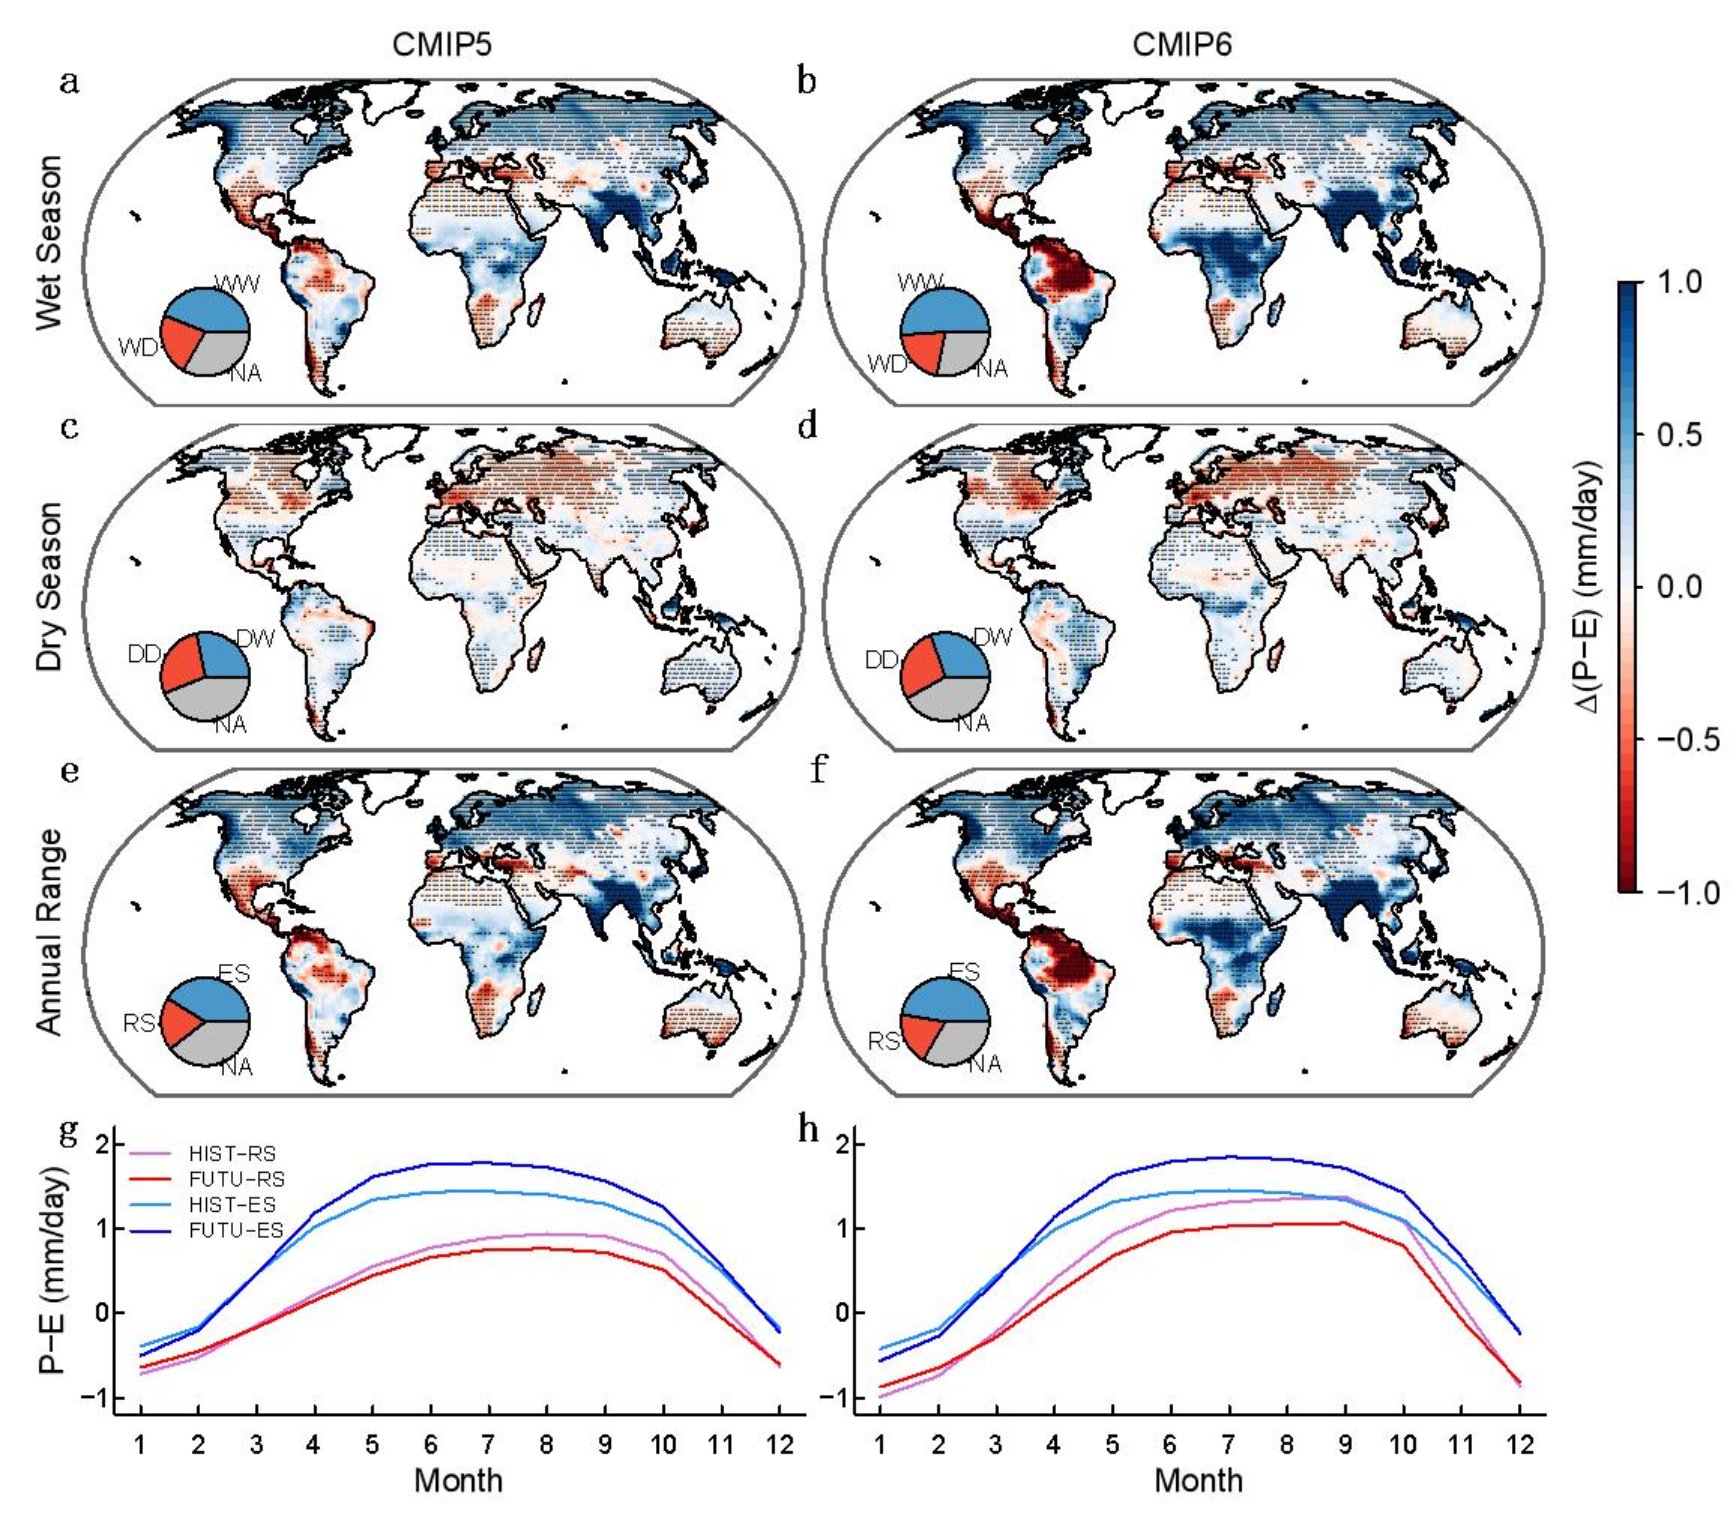
Fig. :Multi–model mean seasonal changes in water availability in CMIP5 and CMIP6. a–d Changes in water availability (Δ(P–E)) in the wet season (a, b) and dry season (c, d) between historical (1971–2000) and future (2071–2100, RCP8.5 or SSP585) periods (future minus historical). e, f The same as (a–d) but for changes in the annual range of P–E between wet and dry seasons. The dry/wet season is defined as three consecutive months with lowest/highest mean P–E in the historical period in each model. Stippling denotes regions where the sign of Δ(P–E) is significantly robust (p value < 0.05), i.e., the sign is consistent with the sign of multi–model means (as shown in the figure) for more than 65% of the 35 CMIP5 models and of the 30 CMIP6 models (see Methods). The pie chart insets show proportions of land area with (stippling) and without robust P–E changes. Antarctica and Greenland are excluded. DD (DW) represents dry season showing robust P–E decreases (increases), while WW (WD) represents wet season showing robust P–E increases (decreases). RS (ES) represents reduced (enhanced) seasonality of P–E, assessed as robust decreases (increases) in the annual range of P–E. “NA” represents insignificant changes in P–E (p value > 0.05). g, h Mean seasonal cycle of P–E for RS and ES regions in the historical (HIST) and future (FUTU) periods. The sequence of months is organized to start from the first month of dry season. The shading in g, h shows the standard deviation of P–E across the assessed models.